Heatmaps have revolutionized the way we interpret complex datasets by transforming numerical data into intuitive visual representations that reveal patterns, trends, and amplitude gradients at a glance.
🔍 Understanding the Fundamentals of Heatmap Visualization
In today’s data-driven world, the ability to quickly comprehend large volumes of information has become essential for decision-makers across industries. Heatmaps serve as powerful visualization tools that convert raw data into color-coded matrices, where variations in amplitude are represented through different color intensities. This visual approach enables analysts to identify correlations, outliers, and patterns that might remain hidden in traditional spreadsheets or numerical tables.
The concept behind heatmaps is elegantly simple yet profoundly effective. By mapping data values to a color spectrum—typically ranging from cool colors like blue and green for lower values to warm colors like yellow and red for higher values—these visualizations create an immediate cognitive connection between data magnitude and visual perception. This makes amplitude gradients instantly recognizable, allowing viewers to process information faster than parsing through columns of numbers.
Originally popularized in fields like genomics and financial analysis, heatmaps have expanded their reach into web analytics, user experience design, scientific research, and business intelligence. Their versatility stems from their ability to display multi-dimensional data in a two-dimensional space while preserving the relationship between variables and their respective amplitudes.
📊 The Science Behind Amplitude Gradient Representation
Amplitude gradients represent the rate of change or variation in data intensity across different dimensions. When visualized through heatmaps, these gradients become immediately apparent through color transitions. Understanding how to interpret these gradients is crucial for extracting meaningful insights from your data visualization.
The human eye is naturally adept at detecting color variations and patterns. Research in cognitive psychology demonstrates that our visual system processes color information faster than numerical data, making heatmaps an efficient medium for rapid data assessment. When amplitude gradients are properly mapped to appropriate color scales, viewers can identify high-concentration areas, detect anomalies, and recognize trends within seconds.
Color scale selection plays a critical role in effective amplitude gradient visualization. Sequential color schemes work best for data with ordered values from low to high, while diverging color schemes excel at highlighting deviations from a central value. Perceptually uniform color spaces ensure that equal steps in data value correspond to equal perceived differences in color, preventing misleading interpretations.
Key Components of Effective Amplitude Gradient Mapping
Creating meaningful heatmap visualizations requires careful consideration of several technical elements. The granularity of your data grid determines the resolution at which amplitude variations can be observed. Finer grids reveal subtle gradients but may introduce noise, while coarser grids provide clearer overall patterns but might obscure important details.
Normalization techniques significantly impact how amplitude gradients appear in your heatmap. Min-max scaling stretches your data across the full color spectrum, emphasizing relative differences. Z-score normalization highlights deviations from the mean, making it ideal for identifying outliers. Log transformations can reveal patterns in data with extreme value ranges by compressing high-amplitude differences.
🎯 Practical Applications Across Different Industries
Web analytics professionals leverage heatmaps to visualize user interaction patterns on websites and mobile applications. Click heatmaps show where users engage most frequently, while scroll heatmaps reveal how far visitors navigate down pages. Movement heatmaps track cursor activity, providing insights into visual attention patterns. These amplitude gradients of user behavior inform design decisions that enhance user experience and conversion rates.
In financial markets, traders and analysts use heatmaps to monitor stock performance across sectors and indices. Market heatmaps display hundreds of securities simultaneously, with color intensity representing percentage changes, trading volumes, or volatility measures. This comprehensive view enables rapid identification of market trends and sector rotations that would be impossible to detect through traditional price charts alone.
Scientific researchers employ heatmaps extensively in genomics and proteomics to visualize gene expression data. Clustering heatmaps group similar expression patterns together, revealing genetic relationships and biological pathways. The amplitude gradients in these visualizations represent expression levels across different conditions, tissues, or time points, facilitating the discovery of biomarkers and therapeutic targets.
Healthcare and Medical Diagnostics
Medical imaging has embraced heatmap technology for enhanced diagnostic capabilities. Thermal imaging creates heatmaps of body surface temperatures, where amplitude gradients indicate inflammation, circulation issues, or other physiological conditions. Brain imaging studies use heatmaps to display activation patterns during cognitive tasks, with color intensity representing neural activity levels measured through fMRI or PET scans.
Sports medicine professionals utilize heatmaps to analyze athlete performance and injury risk. Movement heatmaps show where players spend most time on the field, while pressure distribution heatmaps from smart insoles reveal gait abnormalities. These amplitude visualizations guide training programs and injury prevention strategies with data-driven precision.
🛠️ Essential Tools and Technologies for Heatmap Creation
Modern data analysis platforms offer robust heatmap generation capabilities. Python libraries like Matplotlib, Seaborn, and Plotly provide extensive customization options for creating publication-quality heatmaps. These tools support various color schemes, interpolation methods, and interactive features that enhance data exploration.
For web analytics specifically, specialized platforms track user interactions and automatically generate behavioral heatmaps. These services combine session recording with aggregated heatmap visualizations, offering insights into user experience without requiring coding knowledge. The amplitude gradients they produce highlight engagement hotspots and dead zones on web pages.
Business intelligence platforms like Tableau, Power BI, and Google Data Studio incorporate heatmap visualizations as standard chart types. These enterprise solutions connect directly to databases and data warehouses, enabling real-time heatmap generation from continuously updated datasets. Their drag-and-drop interfaces make amplitude gradient visualization accessible to non-technical users.
Open-Source Solutions for Advanced Users
R programming language offers powerful packages such as ggplot2, pheatmap, and ComplexHeatmap for sophisticated heatmap generation. These tools excel at handling large datasets and provide fine-grained control over every visual element. The hierarchical clustering capabilities in these packages reveal natural groupings in data based on amplitude similarity patterns.
JavaScript libraries like D3.js and Chart.js enable developers to create interactive web-based heatmaps that respond to user input. These dynamic visualizations allow viewers to zoom into specific regions, hover for detailed values, and filter data on the fly. The interactivity enhances understanding of amplitude gradients by supporting exploratory data analysis directly in the browser.
📈 Best Practices for Amplitude Gradient Visualization
Selecting the appropriate color palette is paramount for effective communication. Avoid rainbow color schemes, which create false boundaries and mislead interpretation due to perceptual non-uniformity. Instead, use scientifically-designed color maps like Viridis, Plasma, or Cividis that maintain perceptual uniformity and remain distinguishable for colorblind viewers.
Always include a clearly labeled color scale legend that maps colors to data values. This reference enables precise interpretation of amplitude gradients and prevents ambiguity. Consider whether a continuous or discrete color scale better represents your data’s nature—continuous scales work well for measurements, while discrete bins suit categorical classifications.
Context matters enormously in heatmap interpretation. Provide clear axis labels, units of measurement, and data source information. When presenting amplitude gradients over time, ensure chronological order is intuitive. For spatial data, maintain geographical or logical spatial relationships in your heatmap layout.
Common Pitfalls to Avoid
Overcomplicating your visualization with too many data dimensions can overwhelm viewers and obscure the amplitude gradients you want to highlight. Start with the most relevant variables and add complexity only when it genuinely enhances understanding. Simplicity often communicates more effectively than comprehensiveness.
Improper data scaling distorts amplitude gradient perception. When comparing multiple heatmaps, use consistent color scales to enable valid comparisons. If different datasets require different scales, clearly indicate this difference and explain the rationale to prevent misinterpretation.
Ignoring the limitations of your display medium can render heatmaps ineffective. What looks clear on a high-resolution monitor may become indecipherable when printed or viewed on mobile devices. Test your visualizations across different platforms and adjust cell sizes, color contrast, and resolution accordingly.
🚀 Advanced Techniques for Enhanced Data Analysis
Hierarchical clustering combined with heatmaps reveals hidden structure in complex datasets. By reordering rows and columns based on similarity, dendrograms emerge that group related variables together. This approach makes amplitude gradient patterns more apparent by placing similar profiles adjacent to each other.
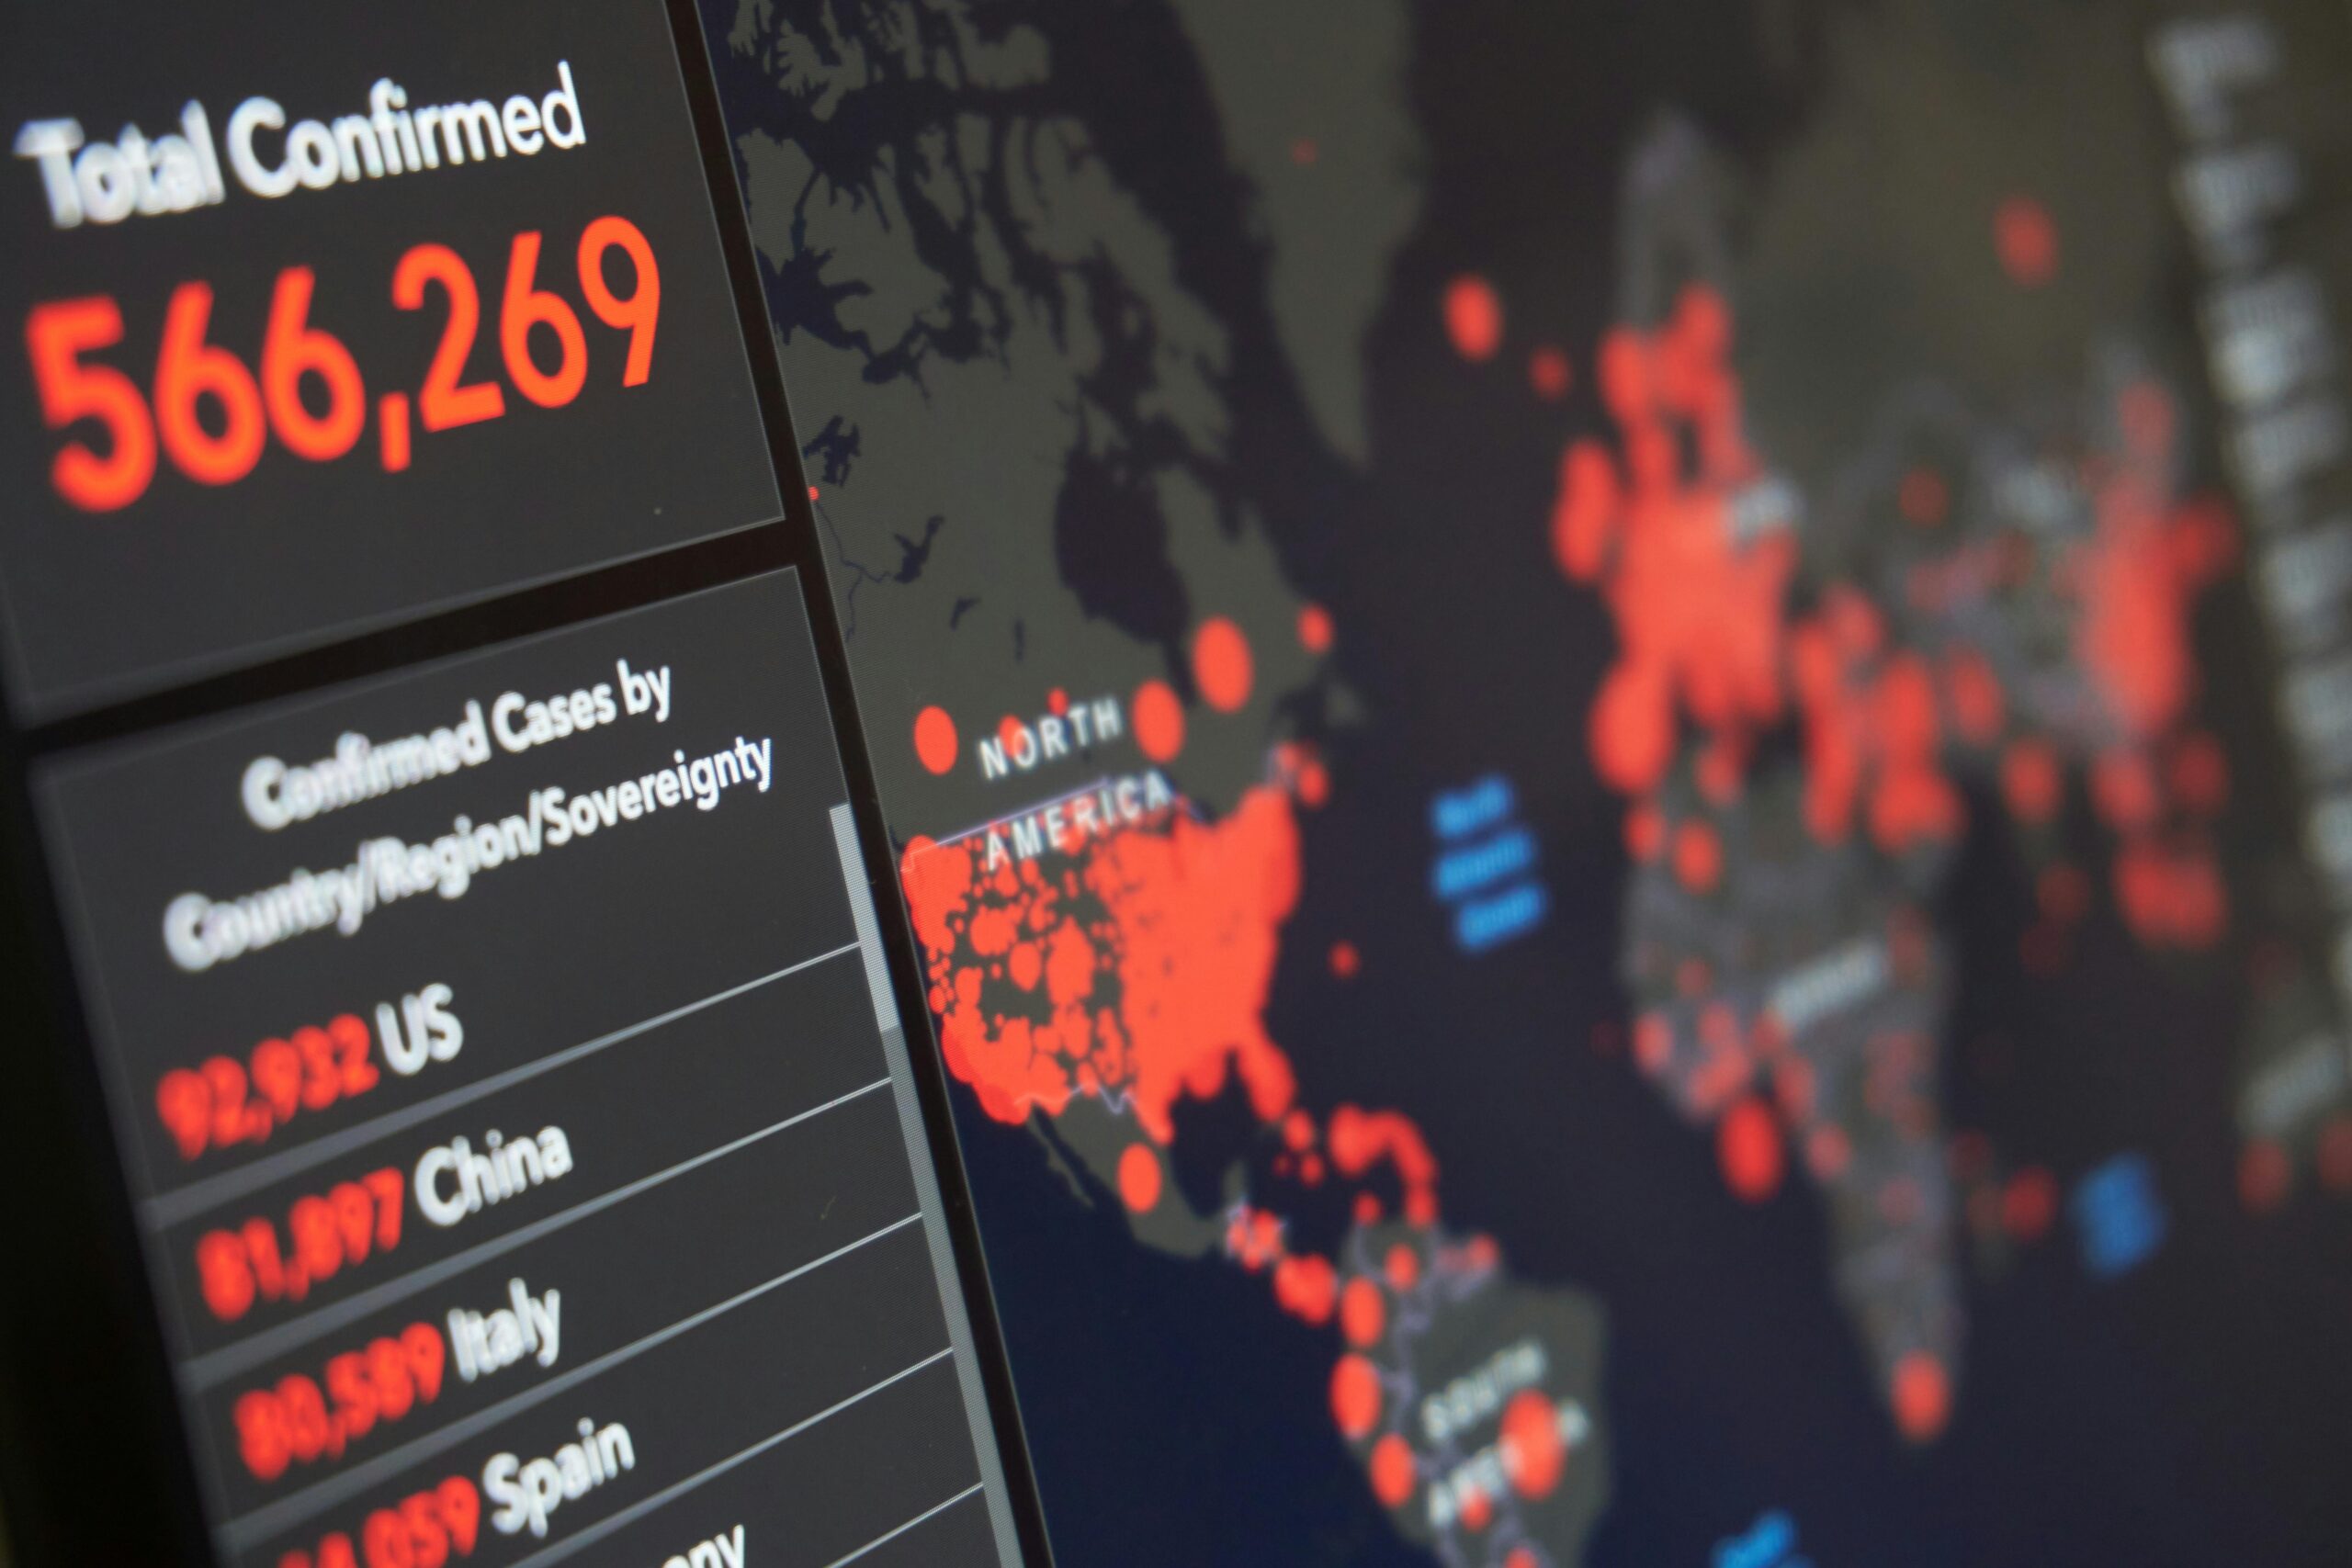
Animation brings temporal dimension to heatmap analysis. By creating sequences of heatmaps representing different time periods, analysts can observe how amplitude gradients evolve. This technique proves especially valuable for monitoring system performance, tracking epidemic spread, or analyzing seasonal business patterns.
Multidimensional heatmaps incorporate additional data layers through symbol size, transparency, or texture overlays. While adding complexity, these composite visualizations can reveal relationships between multiple amplitude measures simultaneously when carefully designed.
Machine Learning Integration
Modern analytics workflows integrate heatmaps with machine learning algorithms. Correlation matrices displayed as heatmaps identify feature relationships before model training. Confusion matrices in classification tasks use heatmap visualization to show prediction accuracy patterns across different classes, with amplitude gradients indicating where models perform well or struggle.
Neural network interpretation benefits from attention heatmaps that visualize which input regions most influence model predictions. In image classification, these heatmaps overlay amplitude gradients on original images, highlighting the pixels the network focused on during decision-making. This transparency helps validate model behavior and detect potential biases.
💡 Optimizing Heatmaps for Decision-Making
Effective data-driven decisions require heatmaps designed with specific audiences in mind. Executive dashboards need high-level amplitude gradient overviews that highlight trends and exceptions. Technical teams benefit from detailed heatmmaps with granular data access. Tailor your visualization complexity, color choices, and accompanying explanations to your audience’s expertise level and decision-making needs.
Interactive features transform static heatmaps into exploratory tools. Implementing tooltips that display exact values on hover, drill-down capabilities that reveal underlying data, and filtering options that adjust displayed amplitude ranges empower users to investigate patterns that catch their attention. This interactivity converts passive data presentation into active knowledge discovery.
Combining heatmaps with complementary visualizations provides richer context. Pairing a correlation heatmap with scatter plots of high-correlation pairs enables deeper investigation. Displaying time-series heatmaps alongside aggregate trend lines helps distinguish persistent patterns from temporary fluctuations. This multi-chart approach leverages the strengths of different visualization types.
🎨 The Future of Amplitude Gradient Visualization
Emerging technologies promise to expand heatmap capabilities further. Augmented reality applications could overlay heatmaps onto physical spaces, displaying real-time sensor data as amplitude gradients in the actual environment. Imagine maintenance technicians viewing equipment temperature distributions through AR glasses, with hotspots immediately visible against the machinery itself.
Virtual reality environments enable truly three-dimensional heatmap exploration. Users could navigate through volumetric data spaces where amplitude gradients extend in all directions, offering unprecedented perspectives on complex multidimensional datasets. This immersive approach may revolutionize how scientists explore simulation results and how business analysts investigate market dynamics.
Artificial intelligence will increasingly automate optimal heatmap generation. Smart visualization systems will analyze data characteristics and automatically select appropriate color scales, clustering methods, and granularity levels. These AI assistants will suggest alternative views and highlight amplitude gradient patterns that human analysts might overlook.

🔄 Implementing Heatmaps in Your Workflow
Begin your heatmap journey by identifying specific questions you want to answer. Are you searching for correlations, monitoring performance metrics, or identifying user behavior patterns? Clear objectives guide appropriate data selection and visualization design choices that effectively communicate amplitude gradients relevant to your goals.
Start simple with basic heatmap implementations using familiar tools before advancing to complex custom solutions. Many spreadsheet applications include basic heatmap formatting options that provide immediate value. As your proficiency grows, graduate to specialized analytics platforms that offer greater flexibility and power.
Iterate based on feedback from stakeholders who use your heatmaps. What patterns do they notice immediately? Where do they request clarification? Which amplitude gradients drive actual decisions? This feedback loop refines your visualization approach and ensures your heatmaps deliver actionable insights rather than just attractive graphics.
Document your methodology, including data sources, preprocessing steps, scaling methods, and color scheme rationale. This documentation ensures reproducibility and helps others interpret your visualizations correctly. When amplitude gradient patterns lead to important discoveries, proper documentation enables validation and builds confidence in data-driven conclusions.
Heatmaps represent a perfect convergence of human perception and data complexity. By transforming abstract numbers into intuitive color patterns, they unlock insights that remain hidden in traditional data presentations. Whether you’re optimizing website design, trading financial instruments, conducting scientific research, or making business decisions, mastering heatmap visualization of amplitude gradients enhances your analytical capabilities and communication effectiveness. The investment in understanding and implementing these powerful tools pays dividends through faster insights, clearer communication, and more confident data-driven decisions across every domain they touch.